
The Art of War, a fifth century Chinese military treatise attributed to military strategist Sun Tzu, has been quoted often in contemporary business. “If you know your enemy and know yourself, you need not fear the results of a hundred battles.” This quote resonates with the importance of benchmarking particularly well. Fast forward to 2017.
Today, against the backdrop of an increasingly data-driven business environment, periodic benchmarking of financial and operational metrics is a critical tool for staffing executives in evaluating their business. Benchmarking not only helps to pinpoint a firm’s strengths and weaknesses, but it can also serve as an iterative guidepost for strategic planning and identifying opportunities for future growth.
The tools. Relevant benchmarking surveys can be more macro or microfocused. We offer several surveys that cast a wide net in capturing overall temporary staffing industry metrics. Due to the higher volume of survey respondents for large staffing segments, such as IT, they also have the benefit of producing valuable segment-specific data. However, as the other “macro” surveys are designed to be generally applicable for all staffing firms, they have less flexibility in targeting questions that address the unique attributes of an individual segment.
This gets to the crux of what makes our IT Staffing Industry Benchmarking Survey an instrumental tool. The report provides data from the past two years on volume and rates for specific skill sets and occupations within the IT field. It also explores industry trends and practices, including VMS prominence, statement- of-work engagements, H-1B utilization and client vertical market demand.
The Results. The recently released 2017 IT Staffing Benchmarking Survey results represent more than $5.2 billion in 2016 IT temporary staffing revenue, generated by 22 participating staffing firms. Aggregate year-over-year revenue growth was 4.3%, roughly in-line with 4% market growth estimated in our US Staffing Industry Forecast. The growth drivers were fairly balanced between volume growth (hours billed up 2.4% year over year), and increases in bill rates (up 1.9% year over year).
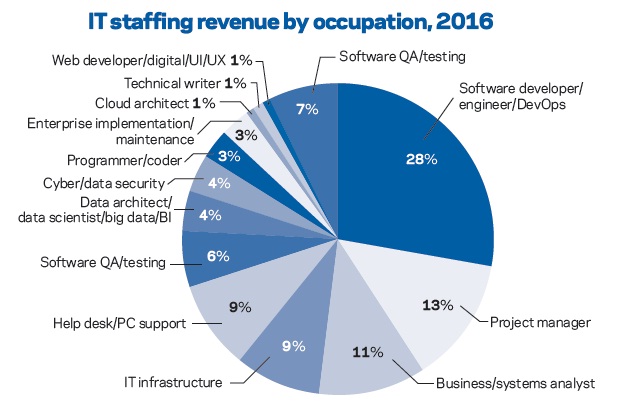
Occupations. Drilling down into the 13 specific IT occupations provided as options, software developer/engineer/ DevOps accounted for the largest portion of revenue captured by the survey, followed by project manager and business/systems analyst.
The data also showed that web developer/digital/UI/UX and Business/systems analyst were the fastestgrowing occupation by revenue. Web developer/digital/UI/UX includes a number of job types, with a common set of trends helping to drive growth within the category, such as secular shifts toward mobile, cloud applications, and ecommerce. A continuously expanding US internet penetration rate also serves as a tailwind for these roles.
Further, while a shortage of available talent, particularly within IT, is a very real concern in the current environment, the survey results clearly illustrated recruiting difficulty is not universal. Specifically, web developer/digital/UI/ UX with an average recruiting difficulty score of 2.8 on a five-point scale (five being most difficult), demand is relatively unencumbered by supply compared to other high demand IT occupations such as cyber/data security (4.3), cloud architect (4.3) and data architect/data scientist/big data/BI (3.9).
On the other end of the spectrum, the only specific occupation to indicate declining revenue from 2015 to 2016 was software QA/testing. Survey responses suggested the availability of talent for these roles is relatively abundant, with an average recruiting difficulty score of 2.3. The implication is the decline in revenue is being driven by diminishing demand trends. This is intuitive as we have seen offshoring and particularly the rise of automation erode the market for software QA/testing talent.
Verticals. The IT staffing market was dominated by three verticals among survey respondents, led by tech/telecom (24%), banking/financial services (23%), and healthcare (13%). No other vertical made up more than 7% of the market. We expect these three verticals to maintain, if not expand, their combined majority share of the market in the near term, each for their own unique set of drivers.
For example, within healthcare, we expect hiring increases, particularly within cybersecurity for hospitals as this has been a primary target of recent cyberattacks, including a variant of Petya in June 2017 and WannaCry in May 2017. Hospitals have been uniquely vulnerable to such attacks as they have generally lagged in computer security investments.
While the full IT Staffing Benchmarking report is available only to firms that completed the survey, we have published a summary report with key findings that is available to all corporate members. For an invitation to participate in the 2018 survey, please send me an email at bwallins@staffingindustry.com.


