

Benchmarking your firm’s financial and operational performance relative to competitors within your industry is critical in managing for longterm success. But the process can only be as effective as the accuracy and specificity of the data available. Direct comparisons of your firm’s metrics versus those of your peers in the temporary staffing industry is a great starting point, which Staffing Industry Analysts facilitates through the semiannual Staffing Industry Benchmarking Consortium, also known as the SIBC. And for those staffing occupational segments at larger scales, including IT, we are able to report data on a segment-specific basis. However, the SIBC is designed to be generally applicable to staffing firms. Therefore, in order to generate benchmarking metrics that are of particular relevance to the unique dynamics of the IT staffing field, we introduced in 2016 an IT Staffing US Benchmarking Survey.
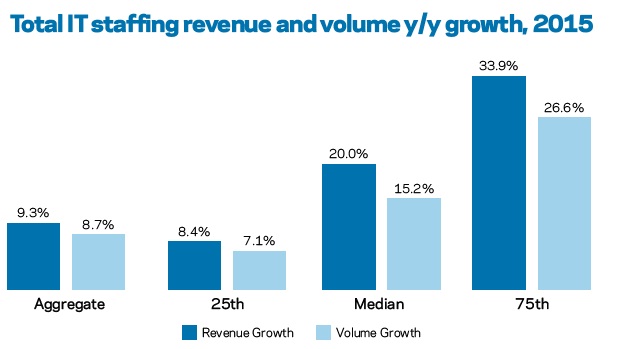
The 17 firms that participated in the inaugural survey generated a total of $2.1 billion in IT temporary staffing revenue in the US market in 2015, which represented aggregate year-over-year growth of 9.3%. While we believe these participants reflect a constructive breadth of scale, structure and focus in their operations, we acknowledge that this sample may not be perfectly representative of the IT staffing market in the US as a whole. For example, the aggregate revenue growth is higher than our 7% estimate for the overall IT staffing market in the US in 2015, which may be indicative of some self-selection bias wherein firms that were performing well were more likely to participate in the survey.
Specific Occupations
Among the 10 specific IT occupations provided as options, software developer accounted for the largest portion of revenue captured by the survey, at 21%, followed by project manager, at 12% and IT infrastructure roles at 8%. The highest year-over-year revenue growth rate by a wide margin was seen in cyber/ data security, at 43% — driven by a 46% rise in hours billed — followed by cloud architect, at 12%. The only two occupations that saw revenue decline in 2015 from 2014 were software QA/testing, down 5%, and help desk/PC support, down 1%. Demand for staffing in these skill sets has been particularly affected by the headwinds of automation and offshoring.
Survey respondents were asked to rate each occupation based on its current recruiting difficulty on a scale of one to five, with five indicating extreme difficulty. Cloud architect and cyber/data security were rated as the most challenging positions to fill, at 3.8, followed closely by data architect/big data at 3.6.
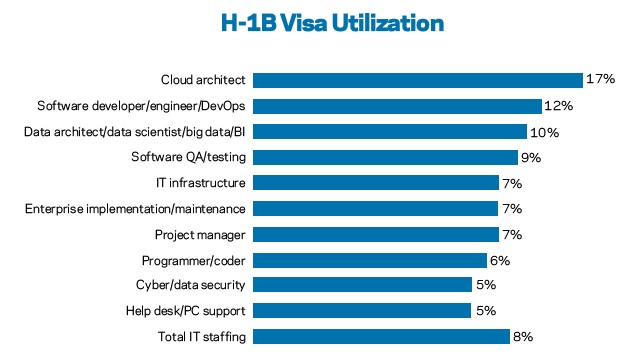
We also inquired about use of the H1B visa program, one avenue for US companies to access foreign workers to address domestic talent shortages. It is no surprise, therefore, that three of the four occupations rated highest for recruiting difficulty also showed the greatest levels of H-1B utilization: cloud architect, 17%; software developer, 12%; and data architect/big data, 10%. The exception was cyber/data security, at 5%, which may see lower H- B employment due to restrictions on non-US citizens obtaining the necessary security clearance.
Backing up the findings of some of our other, previous surveys, the two largest vertical markets for IT staffing among survey respondents were tech/ telecom and banking/financial services, representing 29% and 27% of survey revenue, respectively. The third-largest may not be as obvious, however, as the retail sector accounted for 7% of revenue captured in the survey. In recent years, competitive pressures have driven retailers to increase their adoption of data analytics and mobile e-commerce, as well as to invest in data security following a string of highly publicized hacking events.
Conversely, data from this survey confl icted with our previous findings which indicated that a majority of IT staffing business in the US passes through a vendor management system (VMS). In this sample, 55% of aggregate revenue was generated from orders received directly from the client with no VMS involved. Of the remaining 45%, equal portions came from orders received through the VMS and those engagements in which the order originated from direct client contact but was subsequently entered into the VMS for tracking and invoicing. The difference may be due to smaller staffing firms, which tend to work with clients directly more often, making up a greater share of respondents to this survey.
The increasing use of statement-ofwork (SOW) contracts by IT staffing firms — whether for true project or managed service work or otherwise — is a trend we have focused on in prior reports. However, this remains a relatively minor revenue stream for most survey participants relative to traditional staff augmentation deals, representing 6% of all revenue accounted for here and 5% for the median respondent. A few firms are shifting toward SOW with particular alacrity, though, as these engagements represented more than 15% of revenue for firms at the 75th percentile.
While the full report is available only to firms that completed the survey, we have published a summary report with key findings that is available to all corporate member subscribers. If you would like to receive an invitation for your firm to participate in the 2017 survey, please send me an email at abraswell@ staffingindustry.com.


