
In today’s uncertain economic environment, executives want insight on how revenue growth trends and what the outlook is. The SIA’s Pulse survey, produced by the publisher of this magazine, provides both a snapshot of current industry conditions as well as leading indicators, such as trends in new orders, on a timely monthly basis.
Growth: Revenue & Employment
According to the Pulse survey, median revenue growth has accelerated slightly to 7% year over year in the first four months of 2017 compared to an average of 6% last year, but it’s far from the double-digit growth rates observed in years prior.
The monthly temporary help services employment data provided by the US Bureau of Labor Statistics reflect a more pronounced acceleration. Temporary help employment growth averaged 3.9% over the first five months of 2017, with the highest level recorded for May at 4.9%. This represents a welcome acceleration from the 1.4% average during 2016, but is still lower than the average growth of 4.2% in 2015 and 5.5% in 2014 (See Figure 1). Possible drivers of the acceleration include rising business confidence in expectation of a more “pro-business” federal government administration, stabilization of oil prices, and growth in certain areas of industrial staffing such as construction and distribution/warehousing.
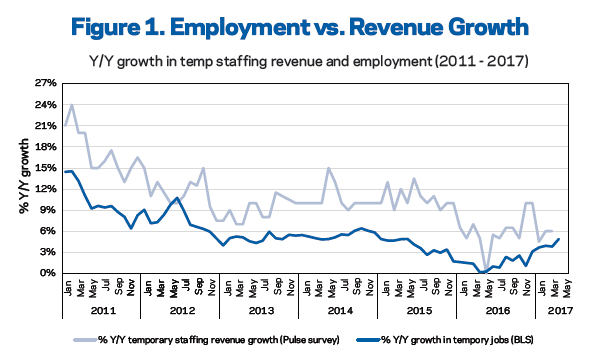
Looking at the longer-term context of the past six years, we see that both the Pulse revenue growth and US Bureau of Labor Statistics’ data on employment growth show a general trend of deceleration, which is not surprising as the economic expansion has continued over a long period of time. Mathematically, the percentage growth gets smaller as the industry gets larger.
Differences: Pulse, BLS Data
Both the Pulse and BLS data show a similar trend. Nevertheless, we note there are some key differences in understanding each metric.
Segment. The Pulse survey is broadly representative of all skill segments of staffing, and the majority of respondents supply professional staffing.
Because the majority of US temporary agency workers fall into the industrial and office/clerical occupations, the BLS employment counts are more reflective of trends in these skill segments, rather than trends in professional staffing.
Workers vs. Dollars. The Pulse survey measures revenue, not the number of workers. Meanwhile, the BLS temporary help employment estimates stem from a broad survey of business establishments regarding the number of workers on their payroll. This makes the BLS data a measure of volume, and not revenue.
The Pulse survey typically reflects 120 to 140 staffing companies and tracks trends in staffing revenue growth, new orders, bill rates, challenges in recruiting and sales, and revenue growth by temporary staffing skill segment and direct hire.
New Orders
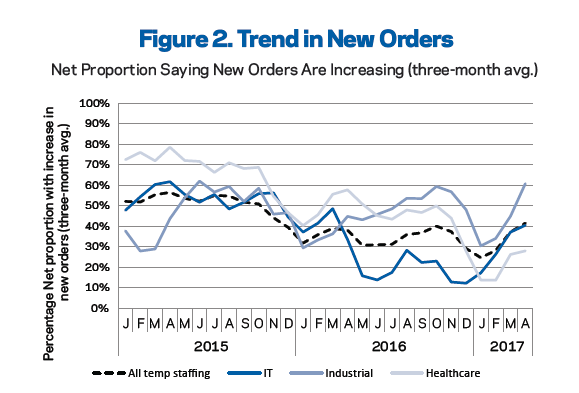
The trend in growth in new orders has also recovered from a dip in the middle of 2016, and remains at levels similar to last year, as shown by the dotted line in Figure 2. The average net percentage of companies reporting an increase in new orders in 2016 was 34%, down from 49.7% in 2015. Figure 2 also shows the trend in new orders for staffing firms supplying IT and industrial workers, as well as staffing firms supplying the healthcare industry vertical. So far in 2017, we note that the net number of firms reporting increasing new orders is higher for IT staffing firms, but lower for healthcare staffing firms. This may be due to the expected slowing in the healthcare sector as the recent wave of newly insured individuals comes to an end.
What Next?
While the demand for temporary jobs and revenue growth depend largely on the economy, executives can benchmark their firms’ revenue growth and trend in new orders on a month-by-month basis by participating in the Pulse survey each month. Staffing executives alert to varied trends may be able to shift their focus to diversifying their customer base or scale up their operations.


