

My first car was about 20 years old, with all the attendant mechanical and electrical issues aged cars can experience. One night while I was driving in an unfamiliar, deserted rural area — in pre-cell phone days — the instrument cluster lost power, disabling the speedometer, tachometer and odometer. Every means I had to determine where I was headed and how quickly I was getting there was lost. What I did have on hand was a hiking GPS, which proved surprisingly capable as a backup speedometer. With that as my only guide, I managed to make my way home, albeit hours later than planned owing to a few wrong turns.
As tricky as it was navigating that night, the experience pales in comparison to how difficult it must be to grow a business and sail the economic tides without a North Star to follow. In life and in business, without systematic, reliable, carefully constructed and considered data, we often rely on improvised or ad hoc methods and tools for finding our way.
For staffing firms establishing their first formal data dashboards and performance monitoring systems or reviewing existing practices, a recent SIA report serves as a wide-ranging but succinct and convenient guide.
The Stories Data Weaves
Written by Research Analyst Amy Horvat, the What to Measure, When to Measure It, and How to Measure It report covers a wide range of concepts, data and metrics, best practices and strategies, and practical considerations for data programs. Overall, it offers insights into building a dashboard that will help you navigate twisting roads when your usual tools fail.
Horvat dives into how vital it is to format data correctly from the start and offers useful guidance. After all, incorrect data formation can hurt your ability to get the appropriate information — and use it correctly. For example, count data tells a different story than ratios, rates and percentages. Count data is useful for observing sizes and producing rankings but often lacks context required for evaluating what these figures mean. In contrast, ratios, rates and percentages describe relations between data, and this added context can provide more meaningful metrics, such as the profitability of an activity.
To illustrate how count and ratio data can tell different stories, consider employment and labor data. For example, in the era between WWII and Covid-19, the highest unemployment level occurred in October 2009, with 15.4 million people looking for but not finding work that month. In contrast, the highest unemployment rate of this period was in November and December of 1982, 10.8% versus 10.0% in October 2009, suggesting it was slightly more difficult to find work at the end of the 1982 recession.
Similarly, the labor force participation rate, representing the prevalence of economic activity among the overall population, peaked at 67.3% from January through April 2000, but today, the labor force itself is dramatically larger, with 25.4 million more people working or looking for work even as the participation rate has fallen by 4.8 points. The accompanying graphic provides additional examples that are directly relevant to staffing operations: activity versus productivity, and revenue versus profitability.
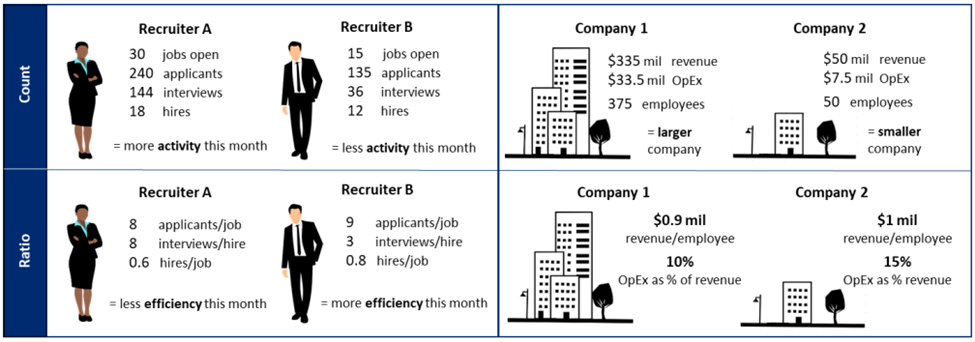
Source: What to Measure, When to Measure It, and How to Measure It
The Right Fit
Horvat’s analysis also dives into selecting metrics and performance indicators — and how these are operationalized. Poorly fitting indicators or inappropriate applications can undermine data efforts or outright damage business activities and morale. For example, one of my high school friends worked at an eye care chain that introduced a bonus scheme whereby the entire staff of a given store would receive an equally divided lump-sum bonus upon meeting specific key performance indicators. However, the single chosen KPI was not aligned with actual revenue- or profit-generating activities — and was gameable. Further, the bonus scheme replaced a prior individual-level commission structure. As a result, the store where my friend worked received the bonuses by gaming the single KPI even as the highest performing staff members departed for other stores that preserved individual commissions. This anecdote illustrates several points discussed in the report: Metrics and KPIs impact culture and must be aligned with business priorities and outcomes. Additionally, measures applied to staff should carefully reflect individual roles and responsibilities.
The report also provides brief discussions of data sources for labor market and economic information as well as predictive analytics and artificial intelligence. Additionally, it contains links to additional SIA research to enable readers to take a deeper dive on select topics. For those who want to avoid finding themselves lost, this report provides some of the tools they’ll need to keep their programs on the road — not in a ditch.
For more information on establishing and utilizing data, metrics and key performance indicators in staffing businesses, see SIA’s report, What to Measure, When to Measure It, and How to Measure It: Using Data Metrics in Recruitment Agencies.


